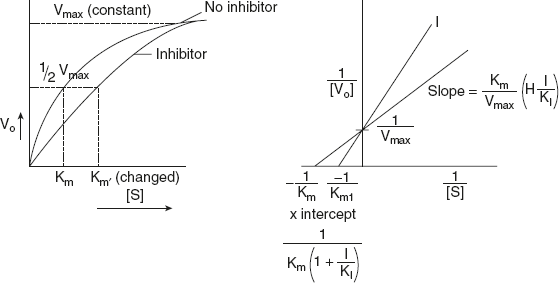
Figure 6.20 Competitive Inhibitor
The graph Figure 6.20 shows that
- As the concentration of inhibitor ↑ es
→the affinity for [s]↓s - But here Vmax remains constant.
Note that as [S] → ∞, VO → Vmax, for any value of inhibitor concentration.
(However, the greater the concentration of I, the greater the [S] must be to approach Vmax. Thus, I does not affect the turnover number of the enzyme. Rather, the presence of I has the effect of making [S] appear more dilute than it actually is, or attentively, making Km appear larger than it really is.)
From these two points, we can make out that I is competitive inhibitors.
Note: We can determine Km value from the hyperbolic curve but not Ki, so we have to find out with LB plot.
Leave a Reply